
Organisations with large Splunk deployments, especially those using Splunk Enterprise Security, understand the importance of having data sources properly mapped to the Splunk Common Information Model (CIM) data models. Poor CIM compliance yields poor security insights, as Splunk Enterprise Security utilises data model searches almost exclusively in its security use-case correlation searches.
Something that has been difficult in the past is measuring the level of CIM compliance across the various data models and data sources in Splunk, which is where the “’Data Model Wrangler” for Splunk can help.
The Data Model Wrangler was built as part of a client engagement to provide a “health-check” dashboard for data models and data in their environment. The app has now been released to Splunkbase (with the permission of the client) for the Splunk community to use, and is available here.
Background
What is a data model in Splunk?
A data model in Splunk provides a pre-defined hierarchical structure to which data from different sources containing similar types of events, can be mapped. This mapping happens at search time, so it can be applied to data that has already been indexed.
To be included in a data model, events need to be tagged appropriately. Event types and tags are used in Splunk to achieve this.
The benefit here is that instead of searching individual sources for common types of events (e.g. authentication events), you can search against the Authentication Data Model, which yields authentication events from all mapped data sources.
What is the CIM in Splunk and why is it important?
The CIM is a standardised collection of data models that are packaged into a Splunk app that can be installed in any Splunk environment.
Why the CIM is important is something best summed up by the Splunk CIM documentation:
Why the CIM exists
The CIM helps you to normalise your data to match a common standard, using the same field names and event tags for equivalent events from different sources or vendors. The CIM acts as a search-time schema (“schema-on-the-fly”) to allow you to define relationships in the event data, while leaving the raw machine data intact.
After you have normalised the data from multiple different source types, you can develop reports, correlation searches, and dashboards to present a unified view of a data domain. You can display your normalised data in the dashboards provided by other Splunk applications such as Splunk Enterprise Security and the Splunk App for PCI Compliance. The dashboards and other reporting tools in apps that support CIM compliance display only the data that is normalised to the tags and fields defined by the Common Information Model.
How does the app work?
First, we need a way of scoring CIM compliance. We divided this up into two separate metrics: mapping quality and field data quality.
Mapping quality
Most sources of data are not going to have all the fields available in a data model for events of that type. For instance, the Authentication Data Model has a ‘user agent’ field, but not all authentication events (from different sources) are going to have this field. Some might, but not all will.
However, there is a minimum set of fields that we would expect all authentication events to contain. For example, username, source, destination, success/failure status, application etc.
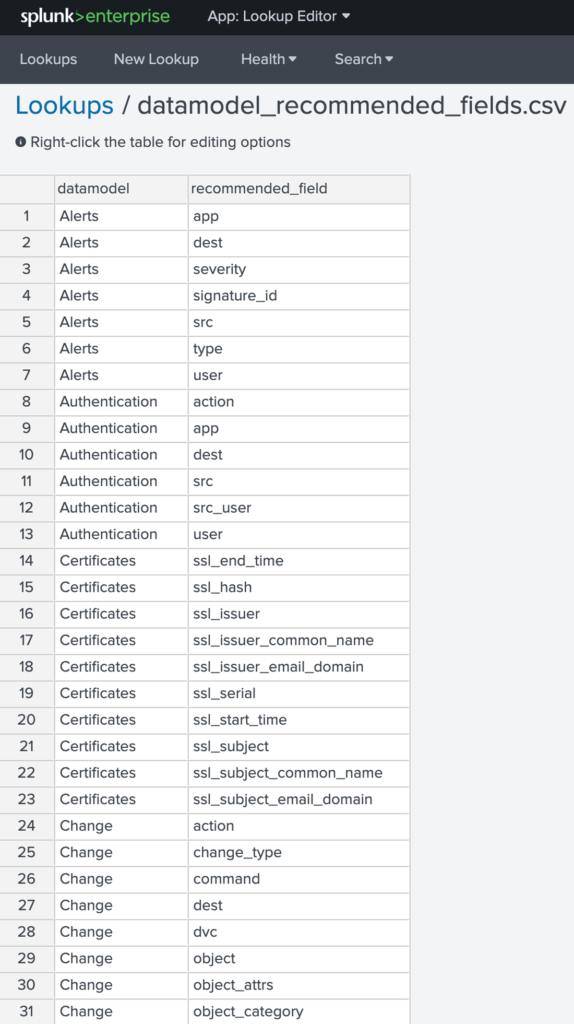
In the Splunk CIM documentation, these fields are called recommended fields. A ‘splunk_recommended_fields.csv’ lookup was created for this app by going through the documentation and listing out each data model and the recommended fields for each. At this stage, we don’t believe this information is available within Splunk itself through the CIM app, although it would be handy if it were. This has been submitted as a new idea to the Splunk Ideas portal.
Now that we have a lookup containing the recommended fields for each data model, we can calculate a percentage of the recommended fields that are found within each data source for each data model. If all recommended fields are found in a data source for the data model, the mapping quality score is 100%.
Finally, we get an average of the mapping quality percentage for all data sources in a data model to calculate the overall mapping quality of that data model.
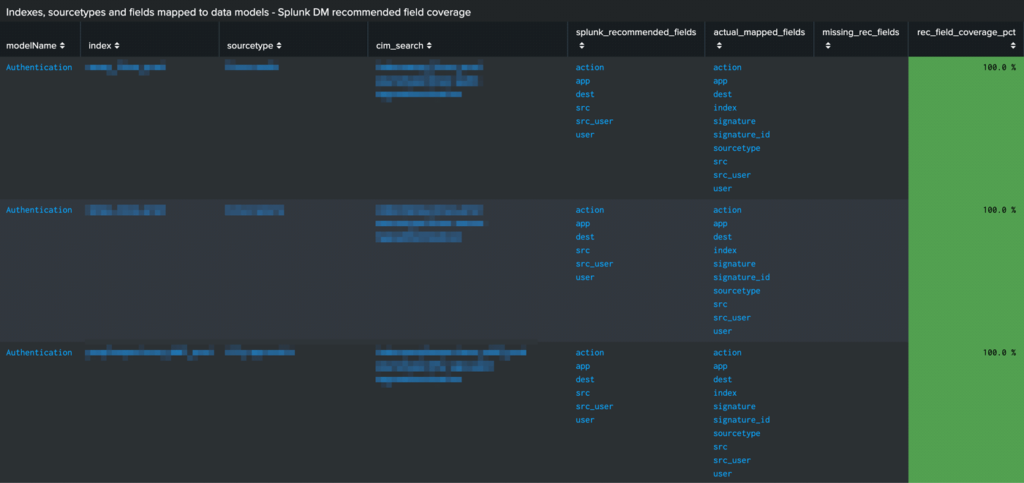
Individual log source quality – All recommended fields are found in each of the above log sources, so the mapping score is 100% for those data sources above
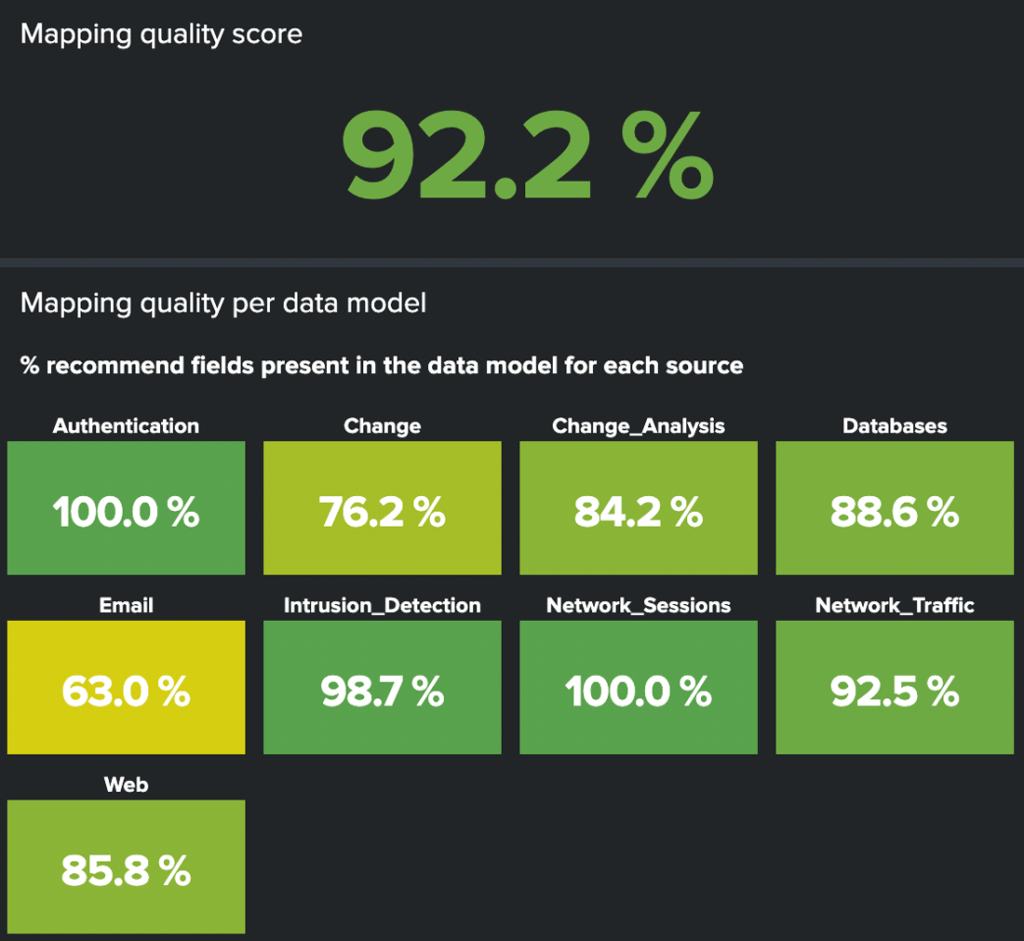
Data model mapping quality – The single value at the top is the average score for all data models, and below is the average mapping quality across all data sources in each data model
Field data quality
This one is a little more complicated and makes use of parts of an existing Splunk app called CIM Validator to derive some of this information from, specifically the search that calculates the field coverage and unique values for each field in the given data source.
What we are looking for here is coverage percentage across the data for each recommended field in each data model and data source. It’s fine for non-recommended fields to have 0% coverage in the events. What we care about here is that the recommended fields are mapped and that there is decent coverage of those fields in the data.
Following the authentication example, we don’t want to see only 25% of events with a ‘user’ field mapped. Not having 100% of events with this field would mean either that the data is badly tagged, i.e. picking up events that aren’t truly authentication events, or that this data is incomplete or otherwise not fit for purpose.
The overall data quality score for a sourcetype is determined as the average of recommended field coverage in the data for each data source in each data model. For example, if there are 6 recommended fields for the Authentication data model and a log source has 5 of those fields with 100% coverage, but one field with only 25% coverage, that would bring the average recommended field coverage score to 87.5%.
To get the overall field data quality score for a data model, we get the overall average data quality score of all data sources in that data model.
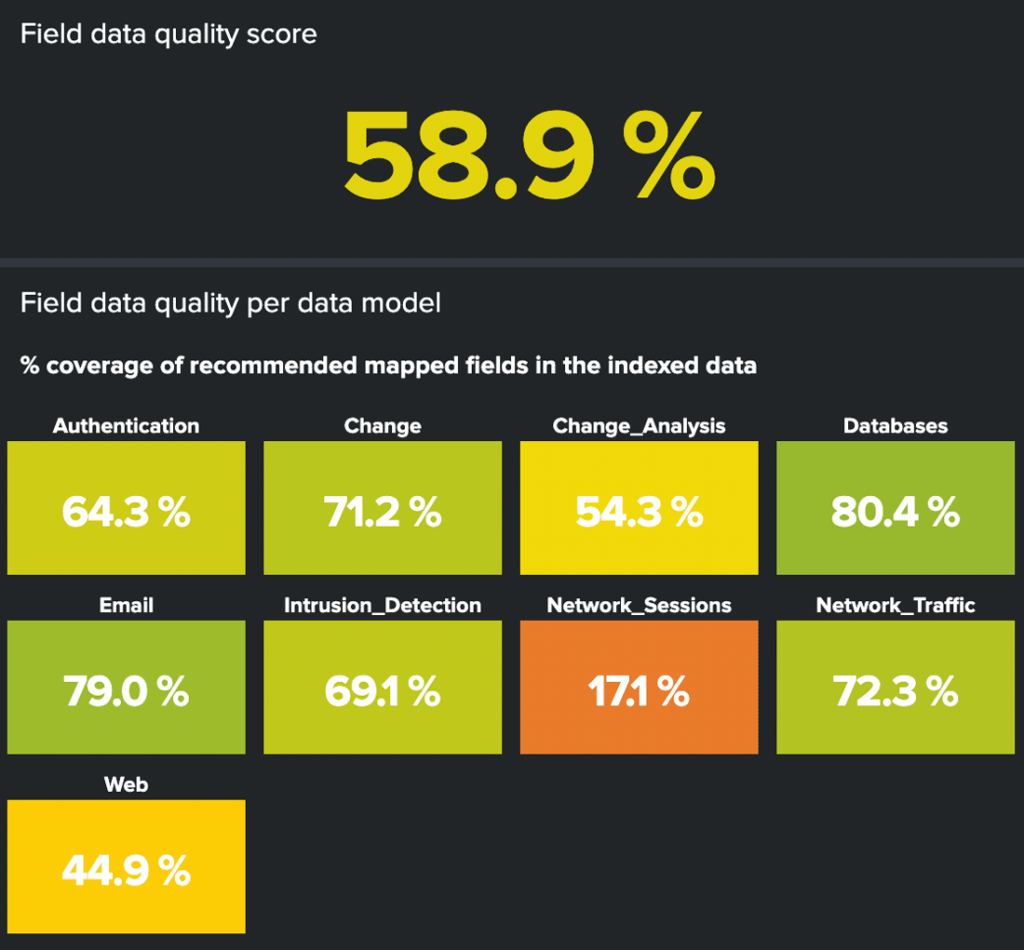
Field data quality score – The single value at the top is the average score for all data models, and below is the average field data quality score of all data sources in each data model
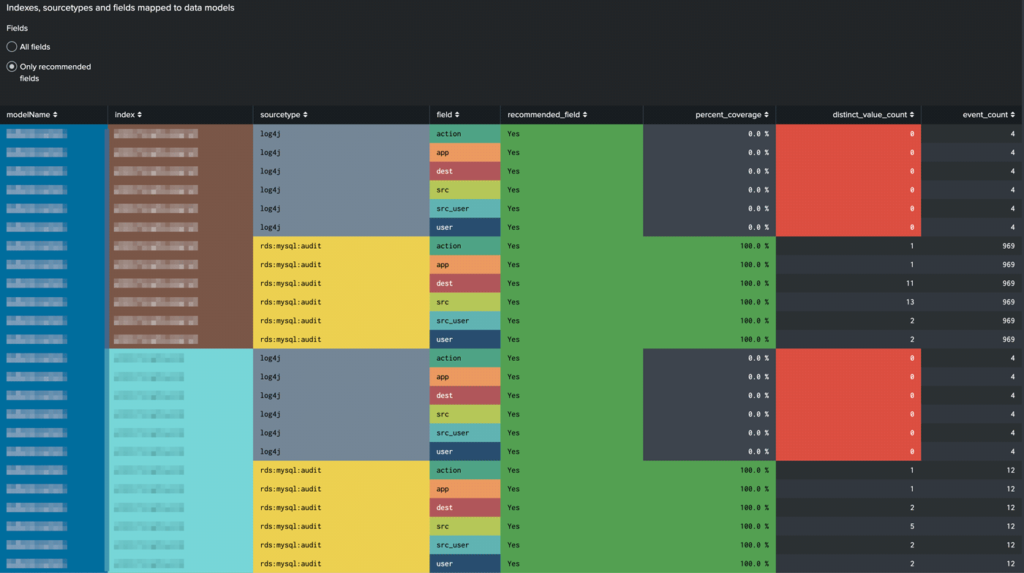
Field-level data quality by data source ‘rds:mysql:audit’ events have 100% recommended field coverage across the 969 events for the Authentication data model. Therefore this source gets 100% mapping quality and 100% data quality. ‘log4j’ events have no coverage on any of the recommended fields, so this gets 0% mapping quality and 0% data quality. Clicking on rows above will drill down to the CIM Validator app for further details about each source.
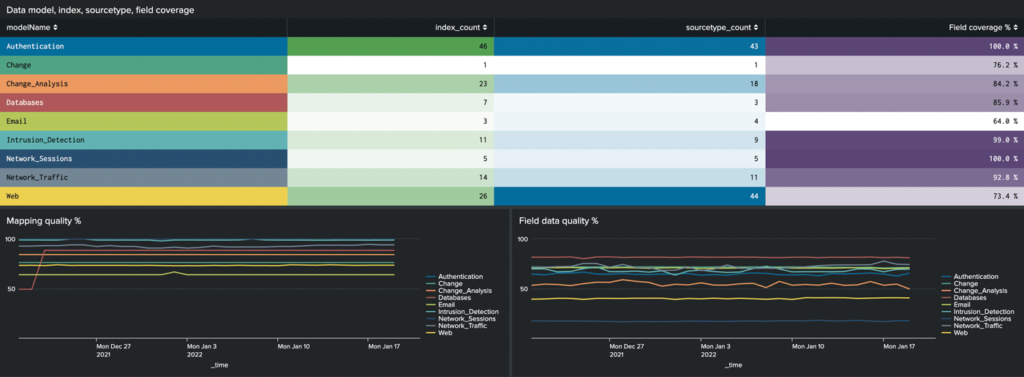
The app also provides a breakdown of the number of indexes and sourcetypes contained within each index, along with the average recommended-field coverage % of each sourcetype. The daily overall scores per data model are stored in a summary index and used to track historical trending of those values. The intention is to obviously see improvement in the overall scores over time as data/mapping issues are resolved.
Overall quality
This score is simply the average of the mapping quality and field data quality score for each data model.
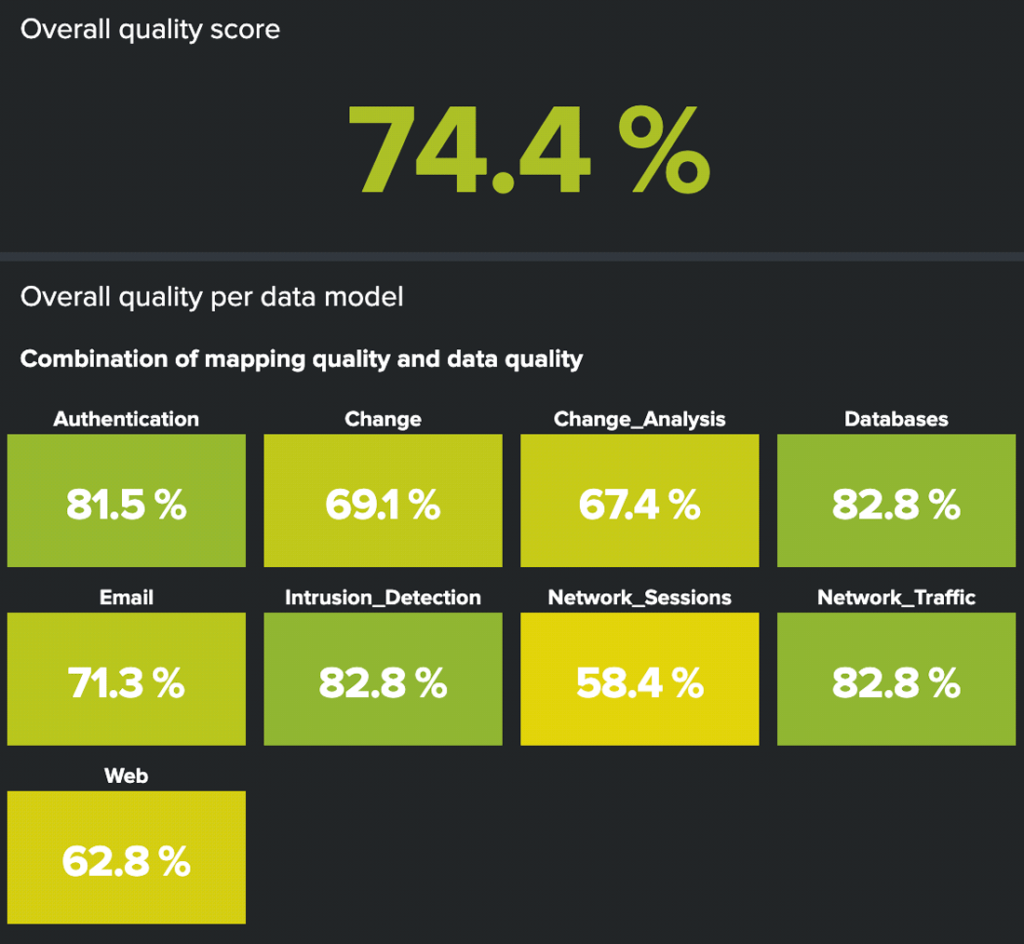
Overall quality score – Calculated from mapping and field data quality scores. For example, if mapping quality were 100% and field data quality were 50%, then the overall quality score would be 75%, i.e. (100%+50%)/2=75%
Under the hood
The main dashboard is populated from a summary index. That is an index that stores summarised data derived from a Splunk search.
There are 3 saved searches that are scheduled to populate the summary index.
- data_model_wrangler_dm_index_sourcetype_field
- For each data model, get a list of indexes and sourcetypes mapped, then for each index and sourcetype, get a list of data model fields available in the data along with counts for each field. Store these results in the summary index.
- data_model_wrangler_field_quality
- For entries stored in the summary index from the ‘data_model_wrangler_dm_index_sourcetype_field’ search, calculate the field data quality by checking coverage of data model fields in the indexed data. Store these results in the summary index.
- data_model_wrangler_mapping_quality
- For entries stored in the summary index from the ‘data_model_wrangler_dm_index_sourcetype_field’ search, calculate the mapping quality by checking for the presence of recommended fields for each index and sourcetype found in each data model. Store these results in the summary index.
The dashboard uses the data stored in the summary index from the above saved searches to populate the various panels.
Tracking and review
Once we gained visibility over which data models and data sources required the most work, we needed a way to review each source and track progress. This was achieved by creating a simple lookup file that is manually added to/updated as each low-quality data source is reviewed. The lookup contains the index, sourcetype and data model columns, used to identify/lookup the data source, along with a ‘reviewed’ column (set to ‘true’ if source has been reviewed), a ‘status’ column (see below for valid values) and a ‘comment’ column. We used to ‘comment’ column to contain comments about findings and/or a link to a Jira ticket to track any changes required to remediate any issues.
The ‘status’ column should be set to one of the three statuses below:
- Open
- In Development
- Done
The ‘Data Model Review’ dashboard provides a quick way of viewing progress and tracking how many data sources need to be reviewed, and how many are in each of the above ‘status’ states above.
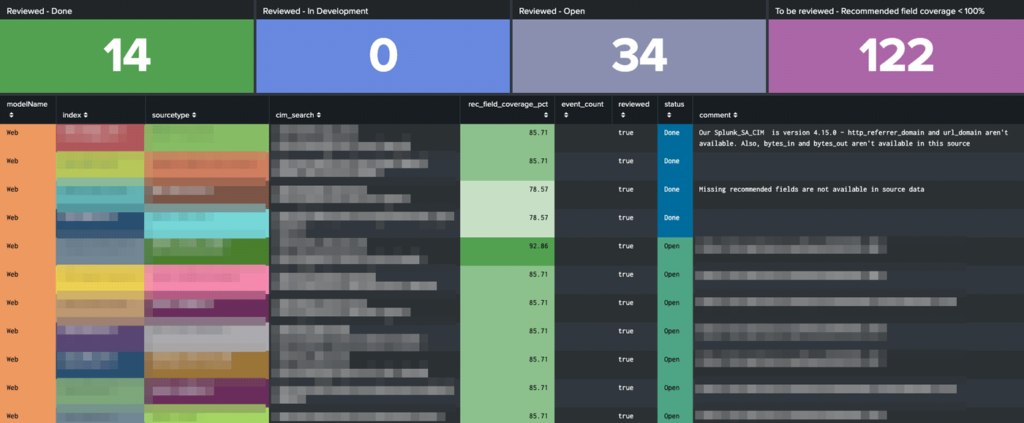
The Data Model Review dashboard shows entries from the ‘data_model_wrangler_health_review.csv’ lookup and provides a way of tracking reviewed data sources
Conclusion
CIM mapping and CIM compliance is never an easy task, but it is important to get it right. Data model wrangler aims to improve visibility of this process and help teams to improve their mapping and field quality by being able to measure their level of CIM compliance across all data models and data sources mapped to them.

Nick Von Korff joined Sourced in 2015 as a Data Visualisation Consultant, specialising in monitoring and data analysis tools, such as Splunk and Datadog. He has worked in IT for over 20 years in a range of industries and roles including systems administration, IVR system programming, network administration, database administration and systems monitoring.


