
On a recent client engagement I had the opportunity to develop Datadog dashboards to monitor a production Microsoft Active Directory deployment and expose vital metrics relating to service health and capacity. Building on basic monitoring of the core infrastructure running these AD/DNS instances, we dived deeper to collect and present service-specific metrics, service statuses and Windows events relating to these functions.
This post covers the steps I followed to find the information required to report on these functions and subsequently configure the Datadog Agent to collect them for use.
Remember to install the “Windows Service” and “WMI” Datadog Integrations from the Datadog web UI.
Windows System Events
A core source of service information within Active Directory instances are Windows system events. Finding the right logs to monitor is relatively straight-forward process:
- Open Windows Event Viewer (run eventvwr from the command line)
- Open the “Application and Services Logs”
- Open each of the application logs of interest and select an event in order to the locate the “Log Name” field. This is required to configure the “Win32 Event Log” section in the Datadog agent config
- The application logs required for AD/DNS monitoring are:
- Active Directory Web Service
- DFS Replication
- Directory Service
- DNS Server
- I tested with the following log-levels enabled, however turned off “Information” after initial testing as Windows services can be very chatty:
- Information
- Warning
- Error
I also configured the Datadog agent to return particular high-value security, application and audit events, as per the following Datadog blog post:
Task Scheduler Events
Task Scheduler events can be gathered from the Windows Event Log by the Datadog agent, however Task Scheduler events are not included in the Windows Event Log by default. Enabling this capability requires a minor registry change.
This post from Datadog covers the steps needed to enable the visibility of Scheduled Task events.
A short-cut to this process is simply applying the below registry configuration to your instance. When testing, the quickest way to do this is creating a file called task_scheduler.reg (or similar) on the instance you are monitoring, copy the below registry information and paste it into the file, then execute the file. This will add the necessary registry key to instruct Windows to enable Task Scheduler logs to be read via the Windows Event Log.
Windows Registry Editor Version 5.00

[HKEY_LOCAL_MACHINE\SYSTEM\CurrentControlSet\Services\EventLog\Microsoft-Windows-TaskScheduler/Operational]
"File"="%SystemRoot%\\System32\\Winevt\\Logs\\Microsoft-Windows-TaskScheduler%4Operational.evtx"
"Primary Module"="Microsoft-Windows-TaskScheduler/Operational"
"DisplayNameFile"=hex(2):25,00,53,00,79,00,73,00,74,00,65,00,6d,00,52,00,6f,00,\
  6f,00,74,00,25,00,5c,00,73,00,79,00,73,00,74,00,65,00,6d,00,33,00,32,00,5c,\
  00,77,00,65,00,76,00,74,00,61,00,70,00,69,00,2e,00,64,00,6c,00,6c,00,00,00
Once this has been completed, you can then include “Microsoft-Windows-TaskScheduler/Operational” as your log_file in the Datadog agent “win32_event_log.yaml” config to receive Task Scheduler events.
win32_event_log.yaml
Bringing these log sources together, we end up with an agent configuration file similar to below. The ‘tags:’ key can be customised to fit in with your environment’s tagging scheme. In a default installation we place this file under C:ProgramDataDatadogconf.d:
---
init_config:
instances:
  - log_file:
      - DNS Server
    tags:
      - dnsserver
      - os:windows
    type:
      - Warning
      - Error


  - log_file:
      - Active Directory Web Services
    tags:
      - activedirectory_web_services
      - os:windows
    type:
      - Warning
      - Error

  - log_file:
      - Directory Services
    tags:
      - activedirectory_directory_services
      - os:windows
    type:
      - Warning
      - Error

  - log_file:
      - DFS Replication
    tags:
      - distributed_file_system_replication
      - os:windows
    type:
      - Warning
      - Error

  - log_file:
      - Application
    tags:
      - os:windows
    event_id:
      - 1000
      - 1002
    type:
      - Warning
      - Error

  - log_file:
      - Security
    tags:
      - os:windows
    event_id:
      - 1102
      - 4740
      - 4728
      - 4732
      - 4756
      - 4735
      - 4724
      - 4625
      - 4648
    type:
      - Audit Failure

  - log_file:
      - System
    tags:
      - os:windows
    event_id:
      - 104
      - 4719
    type:
      - Information

  - log_file:
      - System
    tags:
      - os:windows
    event_id:
      - 41
    type:
      - Critical

  - log_file:
      - System
    tags:
      - os:windows
    event_id:
      - 1001
    type:
      - Error

  - log_file:
      - Microsoft-Windows-TaskScheduler/Operational
    source_name:
      - Microsoft-Windows-TaskScheduler
    tags:
      - os:windows
    type:
      - Warning
      - Error
Windows Service Status
Next, we looked to gather the names of critical services underpinning the environment. Reporting the status is a relatively straight-forward process once the service short names are known.
- Open Services (run services.msc from the command line)
- Open each service of interest and note the “Service Name” field. This is required to configure the “Windows Service” section in the Datadog agent config.
- The services required for AD/DNS monitoring are below (value from “Service Name” field in brackets):
- Active Directory Domain Services (NTDS)
- Active Directory Domain Services (ADWS)
- DNS Server (DNS)
- Intersite Messaging (IsmServ)
- Kerberos Key Distribution Center (Kdc)
windows_service.yaml
From these services, we use the following configuration file for use with the Datadog agent. Again, in a default installation we place this file under C:ProgramDataDatadogconf.d:
---
init_config:

instances:
    -   host: . # "." means the current host
        services:
          - DNS
          - NTDS
          - ADWS
          - DFSR
          - IsmServ
          - Kdc
Windows Service Performance Metrics
Now that we are able to see the availability and events of each service, wouldn’t it be great to see how they are performing? This would be useful to help with capacity management of the service and also to trend and build a baseline from which we can monitor. Here, we will dive deeper into interrogating the performance of Active Directory and the associated DNS services.
So, where can we get these from? A straight-forward question? Not so much.
Windows Management Instrumentation (WMI) provides (among many other management functions for Windows) performance metrics from underlying hardware, applications and services running on the instance.
However before you can start leveraging this data, you first need to locate the suitable WMI classes containing the metrics you need.
This can be accomplished by using the WMI Query Language (WQL), a subset of Structured Query Language (SQL), to get the list of available WMI objects, and by looking for object names matching the services you are interested in. Fortunately, using the PowerShell WMI wrappers, you can filter the results of a Get-WMIObject call with a “where” clause to match only objects with “DNS” in the name, for example:
PS C:\> Get-WmiObject -List | where {$_.name -match "DNS"} | select Name | Format-Table -Wrap -AutoSize

Name
----
Win32_PerfFormattedData_Counters_DNS64Global
Win32_PerfRawData_Counters_DNS64Global
Win32_PerfFormattedData_DNS_DNS
Win32_PerfRawData_DNS_DNS


PS C:\> Get-WmiObject -List | where {$_.name -match "Directory"} | select Name | Format-Table -Wrap -AutoSize

Name
----
CIM_Directory
Win32_Directory
Win32_LogicalProgramGroupDirectory
CIM_DirectoryAction
CIM_CreateDirectoryAction
CIM_RemoveDirectoryAction
CIM_FromDirectoryAction
CIM_ToDirectorySpecification
CIM_DirectorySpecification
Win32_DirectorySpecification
CIM_FromDirectorySpecification
Win32_ShareToDirectory
CIM_DirectorySpecificationFile
CIM_DirectoryContainsFile
Win32_LogicalDiskRootDirectory
Win32_SubDirectory
CIM_ToDirectoryAction
Win32_PerfFormattedData_Counters_DirectoryServicesQOSPolicy
Win32_PerfRawData_Counters_DirectoryServicesQOSPolicy
Win32_PerfFormattedData_DirectoryServices_DirectoryServices
Win32_PerfRawData_DirectoryServices_DirectoryServices
In this particular case, the PerfFormattedData objects contain the metrics we are interested in, so we’ll look at:
- Win32_PerfFormattedData_DNS_DNS; and
- Win32_PerfFormattedData_DirectoryServices_DirectoryServices.
According to Microsoft the difference between PerfRawData and PerfFormattedData counters is:
“The difference between this provider and the Performance Counter provider (PerfRawData) is that the Performance Counter provider supplies raw data and the Cooked Counter provider supplies performance data that appears exactly as in System Monitor.”
Now that we have the name of the WMI objects, let’s see what metrics they contain, again using WQL to interrogate the object:
PS C:\> Get-WmiObject -Query "select * from Win32_PerfFormattedData_DNS_DNS"
__GENUS : 2
__CLASS : Win32_PerfFormattedData_DNS_DNS
__SUPERCLASS : Win32_PerfFormattedData
__DYNASTY : CIM_StatisticalInformation
__RELPATH : Win32_PerfFormattedData_DNS_DNS=@
__PROPERTY_COUNT : 72
__DERIVATION : {Win32_PerfFormattedData, Win32_Perf, CIM_StatisticalInformation}
__SERVER : SERVER01
__NAMESPACE : root\cimv2
__PATH : \\SERVER01\root\cimv2:Win32_PerfFormattedData_DNS_DNS=@
AXFRRequestReceived : 0
AXFRRequestSent : 0
AXFRResponseReceived : 0
AXFRSuccessReceived : 0
AXFRSuccessSent : 0
CachingMemory : 22580
Caption :
DatabaseNodeMemory : 28632
Description :
DynamicUpdateNoOperation : 473
DynamicUpdateNoOperationPersec : 0
DynamicUpdateQueued : 0
DynamicUpdateReceived : 646
DynamicUpdateReceivedPersec : 0
DynamicUpdateRejected : 56
DynamicUpdateTimeOuts : 0
DynamicUpdateWrittentoDatabase : 159
DynamicUpdateWrittentoDatabasePersec : 0
Frequency_Object :
Frequency_PerfTime :
Frequency_Sys100NS :
IXFRRequestReceived : 0
IXFRRequestSent : 0
IXFRResponseReceived : 0
IXFRSuccessReceived : 0
IXFRSuccessSent : 0
IXFRTCPSuccessReceived : 0
IXFRUDPSuccessReceived : 0
Name :
NbstatMemory : 0
NotifyReceived : 0
NotifySent : 0
RecordFlowMemory : 0
RecursiveQueries : 3913
RecursiveQueriesPersec : 0
RecursiveQueryFailure : 0
RecursiveQueryFailurePersec : 0
RecursiveSendTimeOuts : 0
RecursiveTimeOutPersec : 0
SecureUpdateFailure : 0
SecureUpdateReceived : 77
SecureUpdateReceivedPersec : 0
TCPMessageMemory : 0
TCPQueryReceived : 77
TCPQueryReceivedPersec : 0
TCPResponseSent : 77
TCPResponseSentPersec : 0
Timestamp_Object :
Timestamp_PerfTime :
Timestamp_Sys100NS :
TotalQueryReceived : 20999
TotalQueryReceivedPersec : 0
TotalResponseSent : 20997
TotalResponseSentPersec : 0
UDPMessageMemory : 0
UDPQueryReceived : 20922
UDPQueryReceivedPersec : 0
UDPResponseSent : 20920
UDPResponseSentPersec : 0
UnmatchedResponsesReceived : 0
WINSLookupReceived : 0
WINSLookupReceivedPersec : 0
WINSResponseSent : 0
WINSResponseSentPersec : 0
WINSReverseLookupReceived : 0
WINSReverseLookupReceivedPersec : 0
WINSReverseResponseSent : 0
WINSReverseResponseSentPersec : 0
ZoneTransferFailure : 0
ZoneTransferRequestReceived : 0
ZoneTransferSOARequestSent : 0
ZoneTransferSuccess : 0
PSComputerName : SERVER01
PS C:\> Get-WmiObject -Query "select * from Win32_PerfFormattedData_DirectoryServices_DirectoryServices"
__GENUS : 2
__CLASS : Win32_PerfFormattedData_DirectoryServices_DirectoryServices
__SUPERCLASS : Win32_PerfFormattedData
__DYNASTY : CIM_StatisticalInformation
__RELPATH : Win32_PerfFormattedData_DirectoryServices_DirectoryServices.Name="NTDS"
__PROPERTY_COUNT : 175
__DERIVATION : {Win32_PerfFormattedData, Win32_Perf, CIM_StatisticalInformation}
__SERVER : SERVER01
__NAMESPACE : root\cimv2
__PATH : \\SERVER01\root\cimv2:Win32_PerfFormattedData_DirectoryServices_DirectoryServices.Name="NT
ABANRPersec : 0
ABBrowsesPersec : 0
ABClientSessions : 0
ABMatchesPersec : 0
ABPropertyReadsPersec : 0
ABProxyLookupsPersec : 0
ABSearchesPersec : 0
ApproximatehighestDNT : 6366
ATQEstimatedQueueDelay : 0
ATQOutstandingQueuedRequests : 0
ATQQueueLatency : 0
ATQRequestLatency : 0
ATQThreadsLDAP : 0
ATQThreadsOther : 0
ATQThreadsTotal : 5
BasesearchesPersec : 0
Caption :
DatabaseaddsPersec : 0
DatabasedeletesPersec : 0
DatabasemodifysPersec : 0
DatabaserecyclesPersec : 0
Description :
DigestBindsPersec : 0
DirSyncsessionsinprogress : 0
DirSyncsessionthrottlingrate : 0
DRAHighestUSNCommittedHighpart : 0
DRAHighestUSNCommittedLowpart : 45305
DRAHighestUSNIssuedHighpart : 0
DRAHighestUSNIssuedLowpart : 45305
DRAInboundBytesCompressedBetweenSitesAfterCompressionPersec : 0
DRAInboundBytesCompressedBetweenSitesAfterCompressionSinceBoot : 0
DRAInboundBytesCompressedBetweenSitesBeforeCompressionPersec : 0
DRAInboundBytesCompressedBetweenSitesBeforeCompressionSinceBoot : 0
DRAInboundBytesNotCompressedWithinSitePersec : 0
DRAInboundBytesNotCompressedWithinSiteSinceBoot : 0
DRAInboundBytesTotalPersec : 0
DRAInboundBytesTotalSinceBoot : 0
DRAInboundFullSyncObjectsRemaining : 0
DRAInboundLinkValuesPersec : 0
DRAInboundLinkValueUpdatesRemaininginPacket : 0
DRAInboundObjectsAppliedPersec : 0
DRAInboundObjectsFilteredPersec : 0
DRAInboundObjectsPersec : 0
DRAInboundObjectUpdatesRemaininginPacket : 0
DRAInboundPropertiesAppliedPersec : 0
DRAInboundPropertiesFilteredPersec : 0
DRAInboundPropertiesTotalPersec : 0
DRAInboundSyncLinkDeletionPersec : 0
DRAInboundTotalUpdatesRemaininginPacket : 0
DRAInboundValuesDNsonlyPersec : 0
DRAInboundValuesTotalPersec : 0
DRAnumberofNCreplicationcallssinceboot : 0
DRAnumberofsuccessfulNCreplicationcallssinceboot : 0
DRAOutboundBytesCompressedBetweenSitesAfterCompressionPersec : 0
DRAOutboundBytesCompressedBetweenSitesAfterCompressionSinceBoot : 0
DRAOutboundBytesCompressedBetweenSitesBeforeCompressionPersec : 0
DRAOutboundBytesCompressedBetweenSitesBeforeCompressionSinceBoot : 0
DRAOutboundBytesNotCompressedWithinSitePersec : 0
DRAOutboundBytesNotCompressedWithinSiteSinceBoot : 0
DRAOutboundBytesTotalPersec : 0
DRAOutboundBytesTotalSinceBoot : 0
DRAOutboundObjectsFilteredPersec : 0
DRAOutboundObjectsPersec : 0
DRAOutboundPropertiesPersec : 0
DRAOutboundValuesDNsonlyPersec : 0
DRAOutboundValuesTotalPersec : 0
DRAPendingReplicationOperations : 0
DRAPendingReplicationSynchronizations : 0
DRASyncFailuresonSchemaMismatch : 0
DRASyncRequestsMade : 0
DRASyncRequestsSuccessful : 0
DRAThreadsGettingNCChanges : 0
DRAThreadsGettingNCChangesHoldingSemaphore : 0
DRAtotalnumberofBusyfailuressinceboot : 0
DRAtotalnumberofMissingParentfailuressinceboot : 0
DRAtotalnumberofNotEnoughAttrsPerMissingObjectfailuressinceboot : 0
DRAtotalnumberofPreemptedfailuressinceboot : 0
DRAtotaltimeofapplyingreplicationpackagesinceboot : 0
DRAtotaltimeofNCreplicationcallssinceboot : 0
DRAtotaltimeofsuccessfullyapplyingreplicationpackagesinceboot : 0
DRAtotaltimeofsuccessfulNCreplicationcallssinceboot : 0
DRAtotaltimeonwaitingasyncreplicationpackagessinceboot : 0
DRAtotaltimeonwaitingsyncreplicationpackagessinceboot : 0
DSClientBindsPersec : 0
DSClientNameTranslationsPersec : 0
DSDirectoryReadsPersec : 0
DSDirectorySearchesPersec : 0
DSDirectoryWritesPersec : 0
DSMonitorListSize : 23
DSNameCachehitrate : 0
DSNotifyQueueSize : 0
DSPercentReadsfromDRA : 0
DSPercentReadsfromKCC : 33
DSPercentReadsfromLSA : 5
DSPercentReadsfromNSPI : 0
DSPercentReadsfromNTDSAPI : 0
DSPercentReadsfromSAM : 52
DSPercentReadsOther : 8
DSPercentSearchesfromDRA : 0
DSPercentSearchesfromKCC : 1
DSPercentSearchesfromLDAP : 86
DSPercentSearchesfromLSA : 0
DSPercentSearchesfromNSPI : 0
DSPercentSearchesfromNTDSAPI : 8
DSPercentSearchesfromSAM : 1
DSPercentSearchesOther : 1
DSPercentWritesfromDRA : 0
DSPercentWritesfromKCC : 0
DSPercentWritesfromLDAP : 84
DSPercentWritesfromLSA : 0
DSPercentWritesfromNSPI : 0
DSPercentWritesfromNTDSAPI : 0
DSPercentWritesfromSAM : 5
DSPercentWritesOther : 9
DSSearchsuboperationsPersec : 0
DSSecurityDescriptorPropagationsEvents : 0
DSSecurityDescriptorPropagatorAverageExclusionTime : 0
DSSecurityDescriptorPropagatorRuntimeQueue : 0
DSSecurityDescriptorsuboperationsPersec : 0
DSServerBindsPersec : 0
DSServerNameTranslationsPersec : 0
DSThreadsinUse : 0
ExternalBindsPersec : 0
FastBindsPersec : 0
Frequency_Object :
Frequency_PerfTime :
Frequency_Sys100NS :
LDAPActiveThreads : 0
LDAPBindTime : 0
LDAPClientSessions : 7
LDAPClosedConnectionsPersec : 0
LDAPNewConnectionsPersec : 0
LDAPNewSSLConnectionsPersec : 0
LDAPPageSearchCacheentriescount : 0
LDAPPageSearchCachesize : 0
LDAPSearchesPersec : 0
LDAPSuccessfulBindsPersec : 0
LDAPUDPoperationsPersec : 0
LDAPWritesPersec : 0
LinkValuesCleanedPersec : 0
Name : NTDS
NegotiatedBindsPersec : 0
NTLMBindsPersec : 0
OnelevelsearchesPersec : 0
PhantomsCleanedPersec : 0
PhantomsVisitedPersec : 0
RIDPoolinvalidationssinceboot : 0
RIDPoolrequestfailuressinceboot : 0
RIDPoolrequestsuccessessinceboot : 0
SAMAccountGroupEvaluationLatency : 0
SAMDisplayInformationQueriesPersec : 0
SAMDomainLocalGroupMembershipEvaluationsPersec : 0
SAMEnumerationsPersec : 0
SAMGCEvaluationsPersec : 0
SAMGlobalGroupMembershipEvaluationsPersec : 0
SAMMachineCreationAttemptsPersec : 0
SAMMembershipChangesPersec : 0
SAMNonTransitiveMembershipEvaluationsPersec : 0
SAMPasswordChangesPersec : 0
SAMResourceGroupEvaluationLatency : 0
SAMSuccessfulComputerCreationsPersecIncludesallrequests : 0
SAMSuccessfulUserCreationsPersec : 0
SAMTransitiveMembershipEvaluationsPersec : 0
SAMUniversalGroupMembershipEvaluationsPersec : 0
SAMUserCreationAttemptsPersec : 0
SimpleBindsPersec : 0
SubtreesearchesPersec : 0
Timestamp_Object :
Timestamp_PerfTime :
Timestamp_Sys100NS :
TombstonesGarbageCollectedPersec : 0
TombstonesVisitedPersec : 0
Transitiveoperationsmillisecondsrun : 0
TransitiveoperationsPersec : 0
TransitivesuboperationsPersec : 0
PSComputerName : SERVER01As you can see… there are a lot of metrics available for Directory Services.
Going through this list, we can look to exclude anything that has a string value or starts with __. Then it is a matter of selecting the metrics you want to capture.
Using Datadog, we can formulate an agent config YAML file with the metrics we are interested in. All I need to do is give each metric a friendly metric name to display in Datadog, and tell it what type of metric you are capturing. The valid types are:
For our purposes we are using a Gauge metric type.
wmi_check.yaml
I have provided the complete config file below for your reference that contains a cut-down list of the available metrics, capturing only those metrics that our customer was interested in viewing (for now).
Once again, for a default installation we place this config in C:ProgramDataDatadogconf.d:
init_config:

instances:

  - class: Win32_PerfFormattedData_DNS_DNS
    metrics:
      - [TCPResponseSentPersec, dns.tcp.response_sent_persec, gauge]
      - [UDPResponseSentPersec, dns.udp.response_sent_persec, gauge]
      - [TCPQueryReceivedPersec, dns.tcp.query_received_persec, gauge]
      - [UDPQueryReceivedPersec, dns.udp.query_received_persec, gauge]
      - [CachingMemory, dns.caching.memory, gauge]
      - [DatabaseNodeMemory, dns.database.nodememory, gauge]
      - [SecureUpdateFailure, dns.secureupdate.failure, gauge]
      - [RecursiveQueryFailure, dns.recursivequery.query_failure, gauge]
      - [RecursiveQueryFailurePersec, dns.recursivequery.query_failure_persec, gauge]
      - [ZoneTransferFailure, dns.zonetransfer.failure, gauge]
      - [TotalResponseSentPersec, dns.response.total_sent_persec, gauge]
      - [TotalQueryReceivedPersec, dns.query.total_received_persec, gauge]
      - [TotalResponseSentPersec, dns.response.total_sent_persec, gauge]
      - [TotalQueryReceivedPersec, dns.query.total_received_persec, gauge]
      - [ZoneTransferSuccess, dns.zonetransfer.success, gauge]
      - [ZoneTransferFailure, dns.zonetransfer.failure, gauge]
      - [RecursiveQueriesPersec, dns.recursivequery.queries_persec, gauge]
      - [RecursiveQueryFailurePersec, dns.recursivequery.query_failure_persec, gauge]
      - [TotalQueryReceived, dns.query.total_received, gauge]
      - [TotalQueryReceivedPersec, dns.query.total_received_persec, gauge]
      - [TotalResponseSent, dns.response.total_sent, gauge]
      - [TotalResponseSentPersec, dns.response.total_sent_persec, gauge]
    tag_by: Name

  - class: Win32_PerfFormattedData_DirectoryServices_DirectoryServices
    metrics:
      - [LDAPClientSessions, activedirectory.ldap.client_sessions, gauge]
      - [LDAPSearchesPersec, activedirectory.ldap.searches_persec, gauge]
      - [LDAPNewConnectionsPersec, activedirectory.ldap.new_connections_persec, gauge]
      - [LDAPUDPoperationsPersec, activedirectory.ldap.update_operations_persec, gauge]
      - [LDAPClosedConnectionsPersec, activedirectory.ldap.closed_connections_persec, gauge]
      - [LDAPSuccessfulBindsPersec, activedirectory.ldap.successful_binds_persec, gauge]
      - [DSClientBindsPersec, activedirectory.ds.client_binds_persec, gauge]
      - [DSServerBindsPersec, activedirectory.ds.server_binds_persec, gauge]
      - [DSThreadsinUse, activedirectory.ds.threads_in_use, gauge]
      - [DSDirectoryReadsPersec, activedirectory.ds.directory_reads_persec, gauge]
      - [DSDirectorySearchesPersec, activedirectory.ds.directory_searches_persec, gauge]
      - [SAMPasswordChangesPersec, activedirectory.sam.password_changes_persec, gauge]
      - [LDAPActiveThreads, activedirectory.ldap.active_threads, gauge]
      - [LDAPWritesPersec, activedirectory.ldap.writes_persec, gauge]
    tag_by: Name
To save anyone else having to convert the WMI object metrics into a Datadog-friendly format, I’ve compiled an almost complete list of the available metrics for both DNS and Directory Services. Unfortunately due to lack of standard naming with the WMI metrics, much of this was massaged by hand.
Visualising Metrics in a Screenboard
Now that we have the metrics available in Datadog, we can create a Screenboard showing the key metrics, service status and warning/error events being captured by the Datadog agent, along with a link to a Timeboard to explore these metrics over different time-ranges.
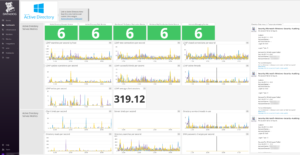
Example Active Directory and DNS Server Datadog screenboard showing metrics, service statuses and events.
You can see that all six DCs are reporting a healthy status for each of the key services.
Having these metrics available has also highlighted an issue with DNS secure update/recursive query failures.
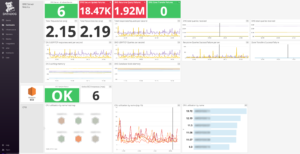
Diving in Further with a Timeboard
Below is a screenshot of the timeboard showing many of the same metrics displayed on the screenboard, but with the ability to set the time-range to display across all metrics, allowing you to investigate performance issues and gain other insights.
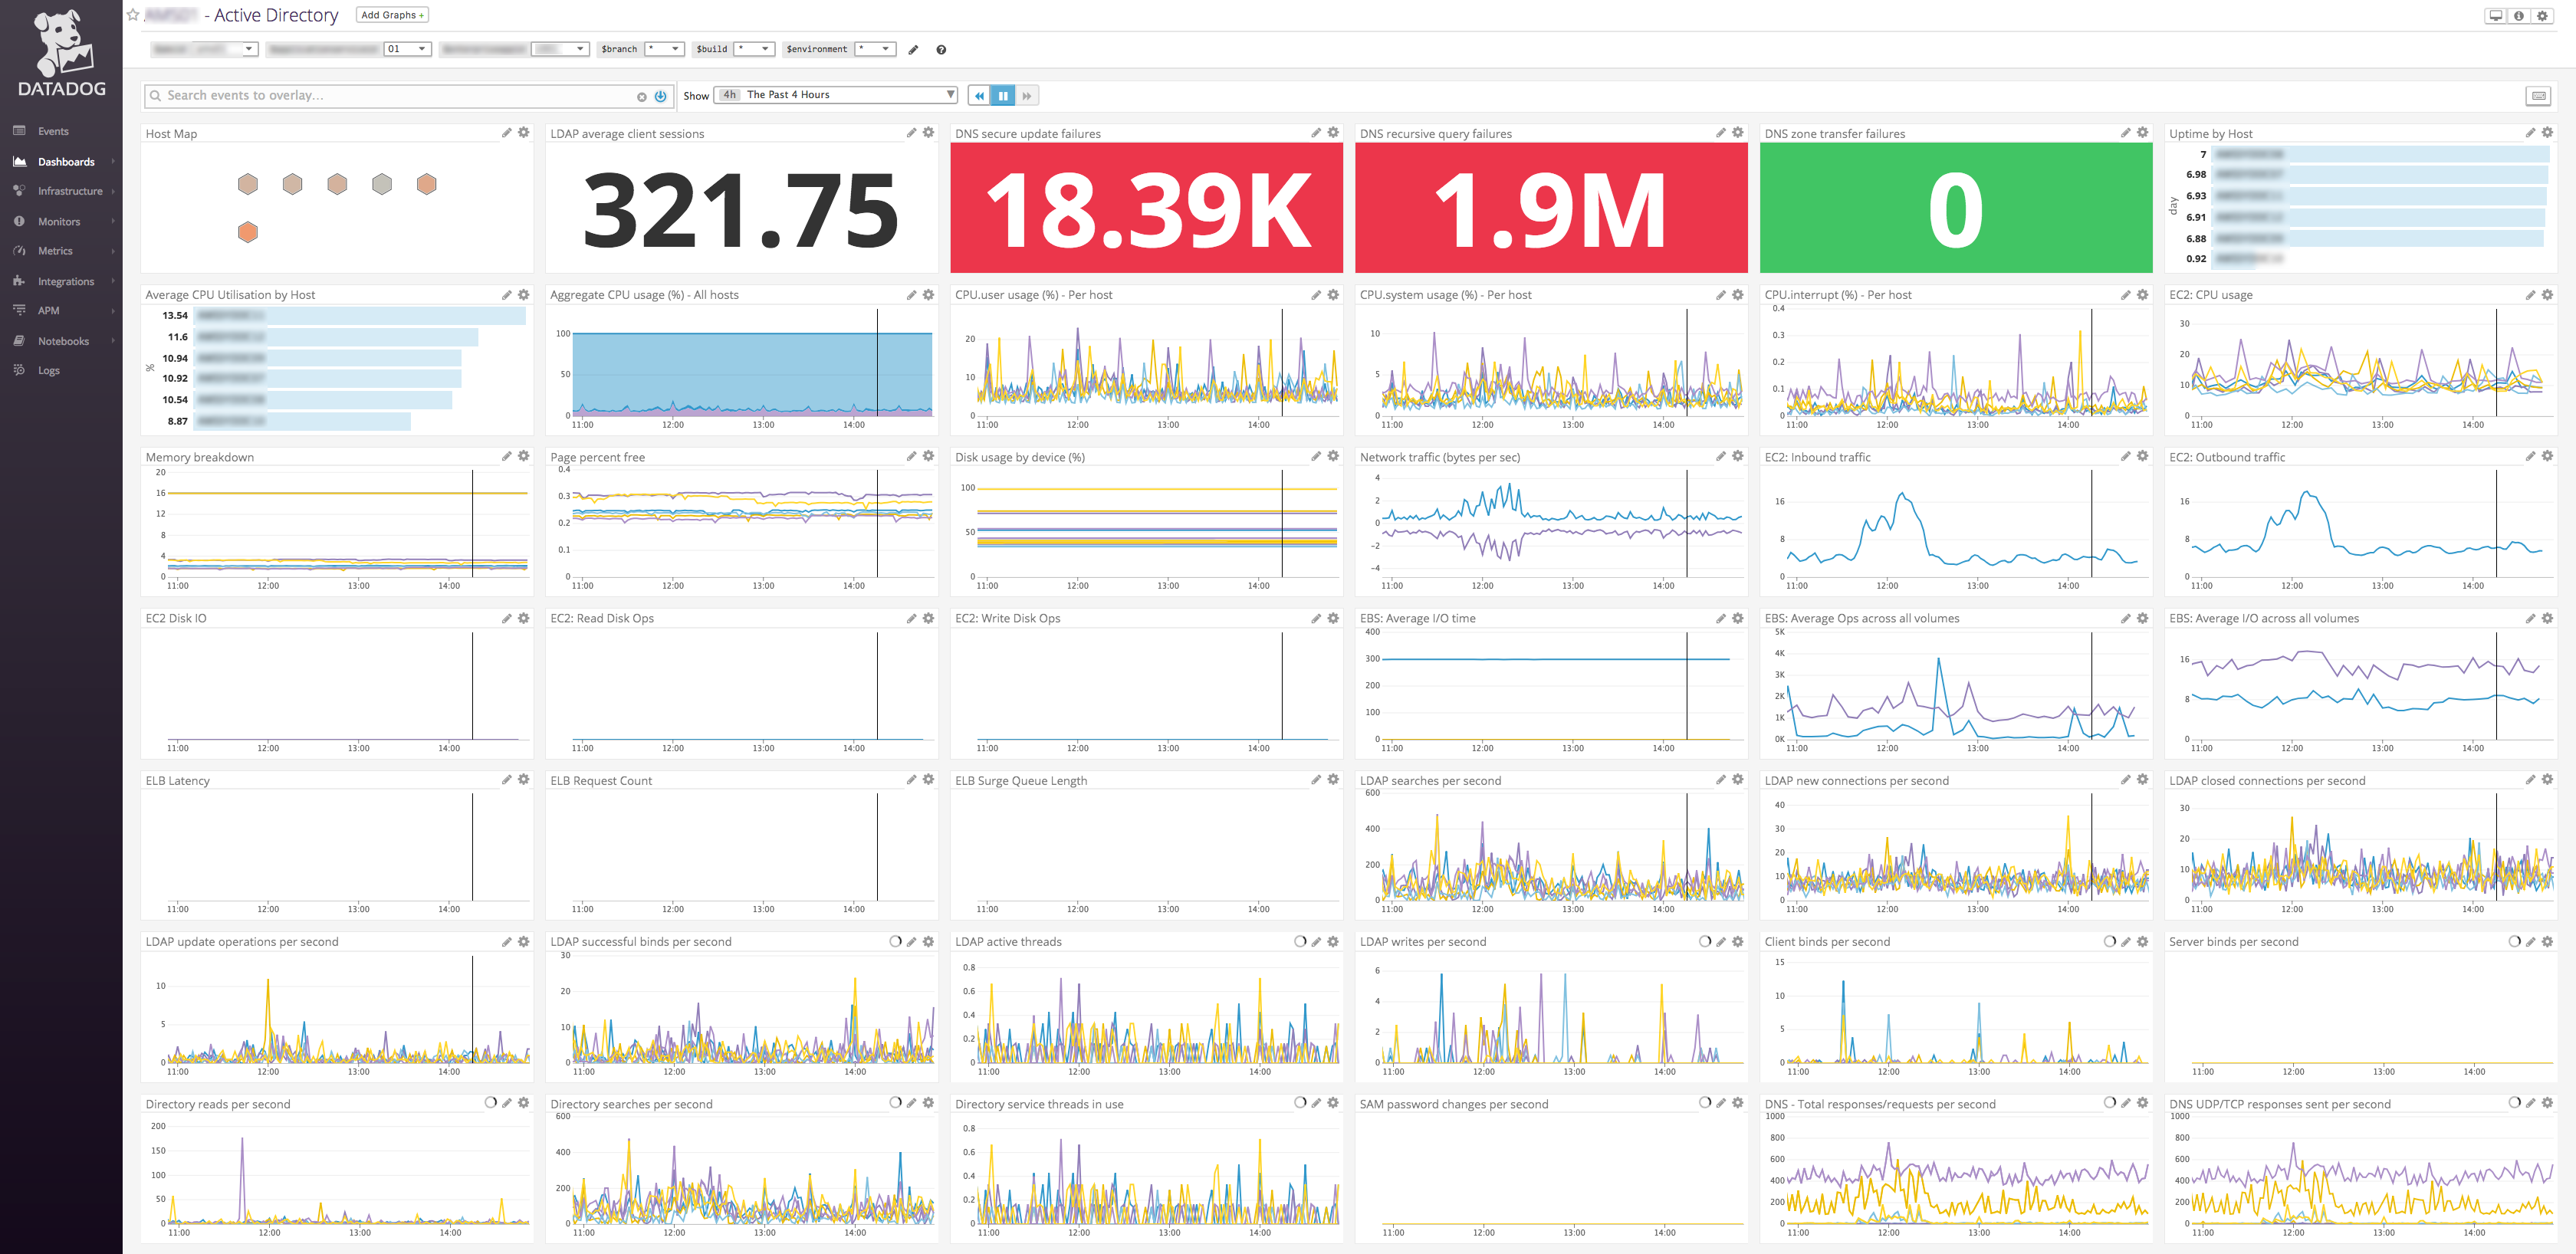
As you can see, with a few simple agent configuration files, Datadog provides a great capability for monitoring core Active Directory services in your environments. Exposing this operational information as a single pane of glass helps increase the effectiveness and speed of incident resolution by removing the need for instance logins as an initial triage step to gather data. This is especially important for environments at scale (tens, hundreds or even thousands of Domain Controllers) when considering capacity management, fault isolation or evolving to proactive automated actions based on trends in your environment.

Nick Von Korff joined Sourced in 2015 as a Data Visualisation Consultant, specialising in monitoring and data analysis tools, such as Splunk and Datadog. He has worked in IT for over 20 years in a range of industries and roles including systems administration, IVR system programming, network administration, database administration and systems monitoring.


